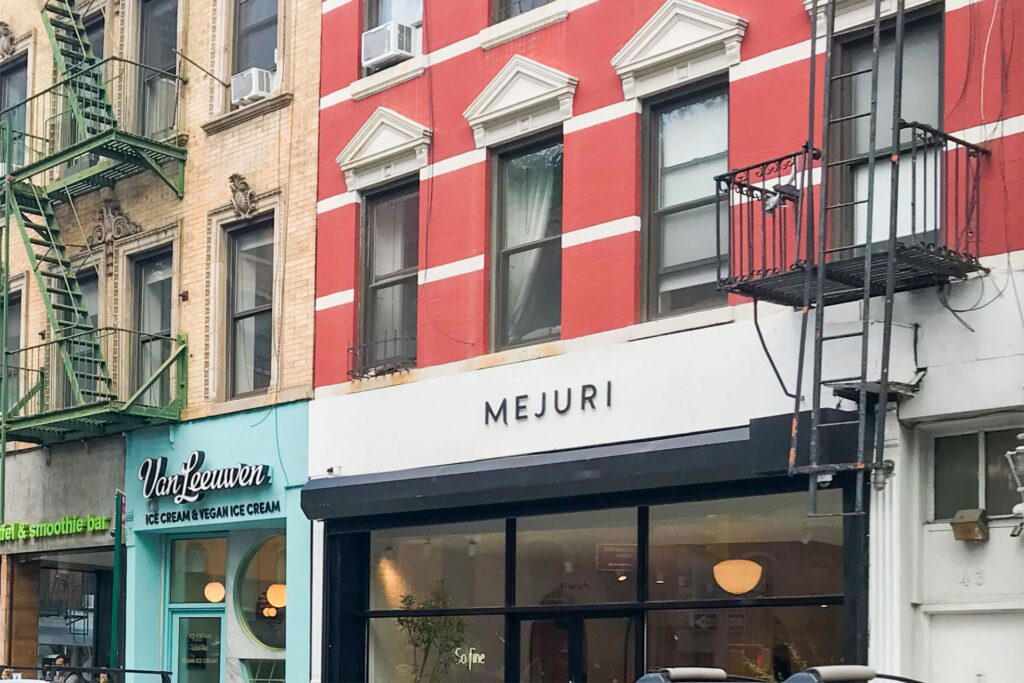
Pros
Cons
Shopper Profile
Trendy yet intimate, Nolita blends upscale shopping with a neighborhood feel. Nestled between Soho and Little Italy, its charming streets are lined with independent boutiques, niche concept stores, and cozy cafes, attracting a fashion-conscious crowd. Despite its small size, the area packs a punch with its mix of global and emerging brands, making it a sought-after destination for both tourists and locals. Rents are competitive, driven by the influx of DTC brands and pop-ups, though much of the real estate is still held by local landlords, preserving Nolita’s distinctive character.

Basic Demographics

Median Household Income: $109,371
Consumer Expenditure: $34,681,482,787
Population: 878,173
Daytime Population: 1,606,677
Source Notes: Data reflects Q3 2023 (Experian)

Household Segment Breakdown

Segment #1: G – Educated Urbanites (77%)
Segment #2: I – Young Urban Singles (16%)
Segment #3: A – Ultra Wealthy Families (4%)
All Other Segments: 3%
Source Notes: Segment data provided by Spatial.ai, an AI-Powered segmentation platform for retail marketers.
Tenant Sales per Square Foot: $1,200
Occupancy Rate: 95%
Anchor Tenants: Everlane, Reformation, Deciem
Tenant Rent/Sales Ratio (%): 33%
Rent $ / Visitor: $28
Source Notes: Data sourced from public and private records.
Average Rent (psf): $197
Median Rent (psf): $171
Rent Range (psf): $171-$201
Rent Variability: Medium
Source Notes: Data provided by Retail by MONA, a New York based brokerage firm.
Preferred ISP(s)
Estimated Permit Timeline (weeks)
Landmarks Risk
Union Labor Disharmony Likelihood

Leave a Review

Select a rating
Overall
Select a rating
Parking
Select a rating
Foot Traffic
Select a rating
Cleanliness
Select a rating
Safety
Drop files here

OR

Allowed file types: .jpg, .jpe, .jpeg, .gif, .png, .bmp, .ico
(You can upload 10 files)
Please drag & drop the files to rearrange the order

Loading...

Look for something else…