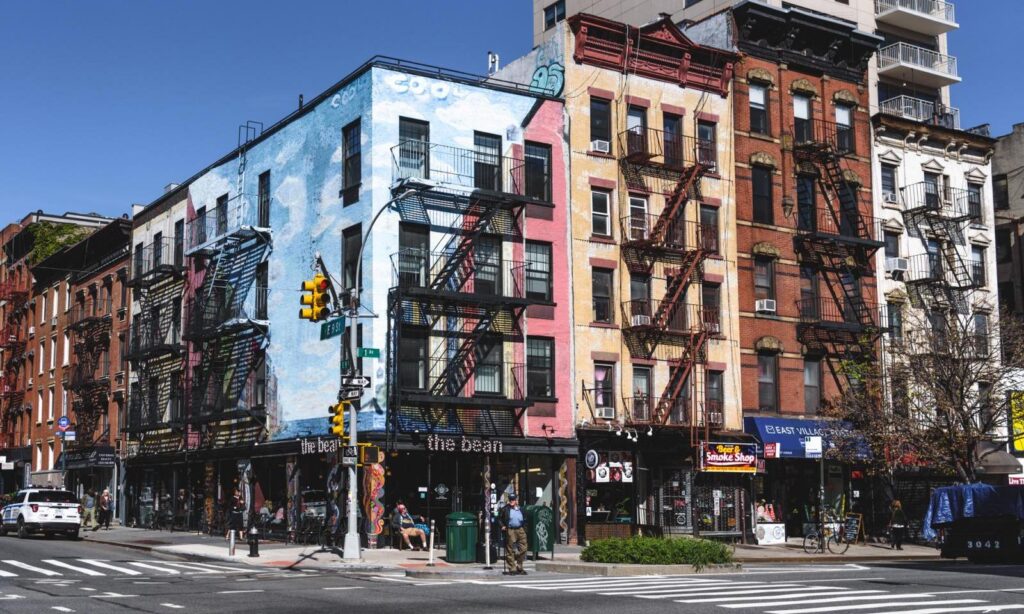
Pros
Cons
Shopper Profile
A mecca of bohemian and alternative culture, the East Village dances to its own beat. A magnet for younger generations, it’s rife with vintage stores, eclectic eateries, and indie music spots. Given its trendy status, rents can be steep, but they vary; landlords range from old-time locals to bigger corporate entities.

Basic Demographics

Median Household Income: $116,132
Consumer Expenditure: $37,263,197,796
Population: 886,165
Daytime Population: 1,806,404
Source Notes: Data reflects 20 minute drive times as of Q3 2023 (Experian) and is provided by Dallimore & Co, a boutique advisory firm specializing in growth strategy, real estate solutions, and M&A for specialty retail and consumer brands.

Household Segment Breakdown

Segment #1: G – Educated Urbanites (66%)
Segment #2: I – Young Urban Singles (18%)
Segment #3: H – Young Professionals (8%)
All Other Segments: 8%

Source Notes: Segment data reflects 0.25mi radius and is provided by Spatial.ai, an AI-Powered segmentation platform for retail marketers.

Tenant Sales per Square Foot: $600
Occupancy Rate: 92%
Anchor Tenants: Whole Foods, Target
Tenant Rent/Sales Ratio (%): 12.5% – 25%
Rent $ / Visitor: $12 – $24
Source Notes: Data sourced from public and private records.
Average Rent (psf): $131
Median Rent (psf): $120
Rent Range (psf): $120-$137
Rent Variability: Medium
Source Notes: Data provided by Retail by MONA, a New York based brokerage firm.
Preferred ISP(s)
Estimated Permit Timeline (weeks)
Landmarks Risk
Union Labor Disharmony Likelihood

2 Reviews on “East Village”

Overall rating
Parking
Foot Traffic
Cleanliness
Safety

Leave a Review

Select a rating
Overall
Select a rating
Parking
Select a rating
Foot Traffic
Select a rating
Cleanliness
Select a rating
Safety
Drop files here

OR

Allowed file types: .jpg, .jpe, .jpeg, .gif, .png, .bmp, .ico
(You can upload 10 files)
Please drag & drop the files to rearrange the order

Loading...

Look for something else…