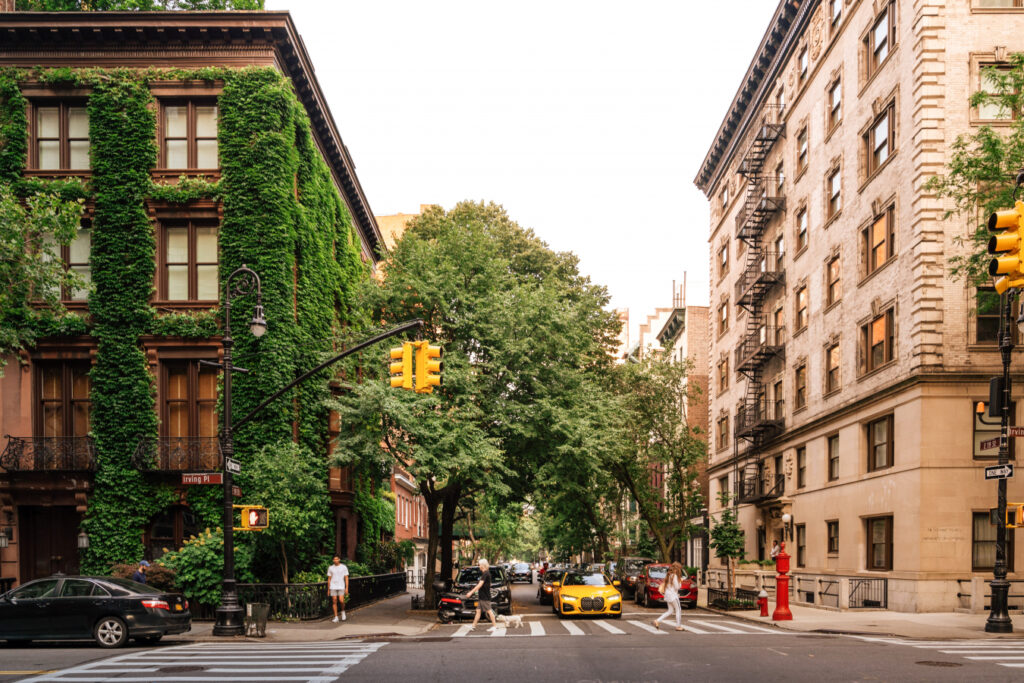
Pros
Cons
Shopper Profile
An enclave of elegance, Gramercy Park’s exclusivity is unparalleled, thanks to its private park. The area is frequented by the well-to-do, seeking its sophisticated boutiques and esteemed eateries. The rental market mirrors its elite reputation, and properties are often in the hands of longstanding local landlords, with some institutional interest.

Basic Demographics

Median Household Income: $116,856
Consumer Expenditure: $34,221,540,424
Population: 791,818
Daytime Population: 2,083,056
Source Notes: Data reflects 20 minute drive times as of Q3 2023 (Experian) and is provided by Dallimore & Co, a boutique advisory firm specializing in growth strategy, real estate solutions, and M&A for specialty retail and consumer brands.

Household Segment Breakdown

Segment #1: G – Educated Urbanites (68%)
Segment #2: A – Ultra Wealthy Families (26%)
Segment #3: H – Young Professionals (3%)
All Other Segments: 3%

Source Notes: Segment data reflects 0.25mi radius and is provided by Spatial.ai, an AI-Powered segmentation platform for retail marketers.

Tenant Sales per Square Foot: $800
Occupancy Rate: 90%
Anchor Tenants: Gramercy Theatre, ABC Carpet & Home
Tenant Rent/Sales Ratio (%): 18.75% – 37.5%
Rent $ / Visitor: $33.75 – $67.5
Source Notes: Data sourced from public and private records.
Preferred ISP(s)
Estimated Permit Timeline (weeks)
Landmarks Risk
Union Labor Disharmony Likelihood

Leave a Review

Select a rating
Overall
Select a rating
Parking
Select a rating
Foot Traffic
Select a rating
Cleanliness
Select a rating
Safety
Drop files here

OR

Allowed file types: .jpg, .jpe, .jpeg, .gif, .png, .bmp, .ico
(You can upload 10 files)
Please drag & drop the files to rearrange the order

Loading...

Look for something else…